A 100 PageSpeed Score: How a Fast Website Generates More Leads (and What's Killing Yours)
What actually slows small-business sites: bloated builders, heavy images, fonts and widgets — what to fix without a rebuild, and when rebuilding pays.
When I tell business owners that my site scores 100 on PageSpeed, the usual reaction is "nice, but who cares about a score." Fair enough — the score itself isn't the goal. But what the score measures is something your customers care about a great deal: how long it takes from the moment they tap your link until they can read, click, and leave their details.
Google's own research has shown the same thing again and again: the slower a page loads, the more people abandon it before ever seeing what you have to offer. Every unnecessary second is leads walking over to the competitor whose site opens instantly. And beyond abandonment, Google uses speed metrics as part of its ranking — so a slow site also gets less traffic in the first place. A double penalty.
After years of fixing slow websites, I can tell you it's almost always the same five suspects. Let's go through them.
The five things that actually kill small-business websites
1. A page builder plus forty plugins
The classic story: the site was built with Elementor or another builder, and over the years plugins piled up — one for forms, one for galleries, one for popups, three "optimization" plugins fighting each other. Every plugin injects CSS and JavaScript files into every page on the site, including pages that never use it. The result: your visitor's browser downloads and executes a mountain of code just to display an "About" page with three paragraphs. The builder itself adds another layer of generic code on top of everything.
2. Unoptimized images
The most common culprit, and the easiest to fix: an image straight out of a camera or Canva, weighing several megabytes, uploaded as-is and displayed at postage-stamp size. The visitor downloads an image thousands of pixels wide to see it in a small grid square. Modern formats (WebP, AVIF), dimensions matched to the actual display size, and lazy loading for below-the-fold images solve most of this problem.
3. Font loading
Beautiful web fonts are a wonderful thing, but the average site loads three or four weights of two fonts from external servers — and while that happens, the text is either completely hidden or jumps and reshapes when the font finally arrives. The fix: host the fonts on your own server, load only the weights you actually use, and configure loading so text is visible immediately, even before the font lands.
4. Third-party widgets
A WhatsApp chat bubble, a floating accessibility overlay, Facebook and TikTok pixels, an embedded Google Map — each one sounds small, and together they sometimes weigh more than the site itself. They load from external servers you don't control, and many of them block or delay the things that actually matter. Incidentally, I wrote a whole article about the floating accessibility overlay — it's problematic for more than just performance. Whatever must stay can be loaded intelligently: after the page has rendered, or only when the visitor actually needs it.
5. Sliders and carousels
The hero slider is perhaps the most popular and least rewarding element on the web: it loads five huge images and an entire JavaScript library so that most visitors see only the first slide and scroll past. One good static, optimized hero image does the job better — both for marketing and for the browser.
The three metrics, in human language
Google measures loading experience through three core metrics (Core Web Vitals). Here's what they mean in practice:
LCP (Largest Contentful Paint) — how long until the largest element on the page — usually the hero image or main headline — appears on screen. This is the metric closest to the feeling of "the site opened": when LCP is slow, the visitor stares at a blank screen wondering whether the link even works.
CLS (Cumulative Layout Shift) — how much the page "jumps around" while loading. You know when you're about to tap a button and an ad loads, pushes everything down, and your tap lands on something else? That's bad CLS. It's caused by images without defined dimensions, fonts that reshape text, and banners injected late.
INP (Interaction to Next Paint) — how quickly the page responds when you interact with it. Opened a menu and it appeared after a half-second of lag? That's bad INP, and the culprit is almost always excess JavaScript keeping the browser busy while the visitor is trying to talk to it.
What does "good" look like?
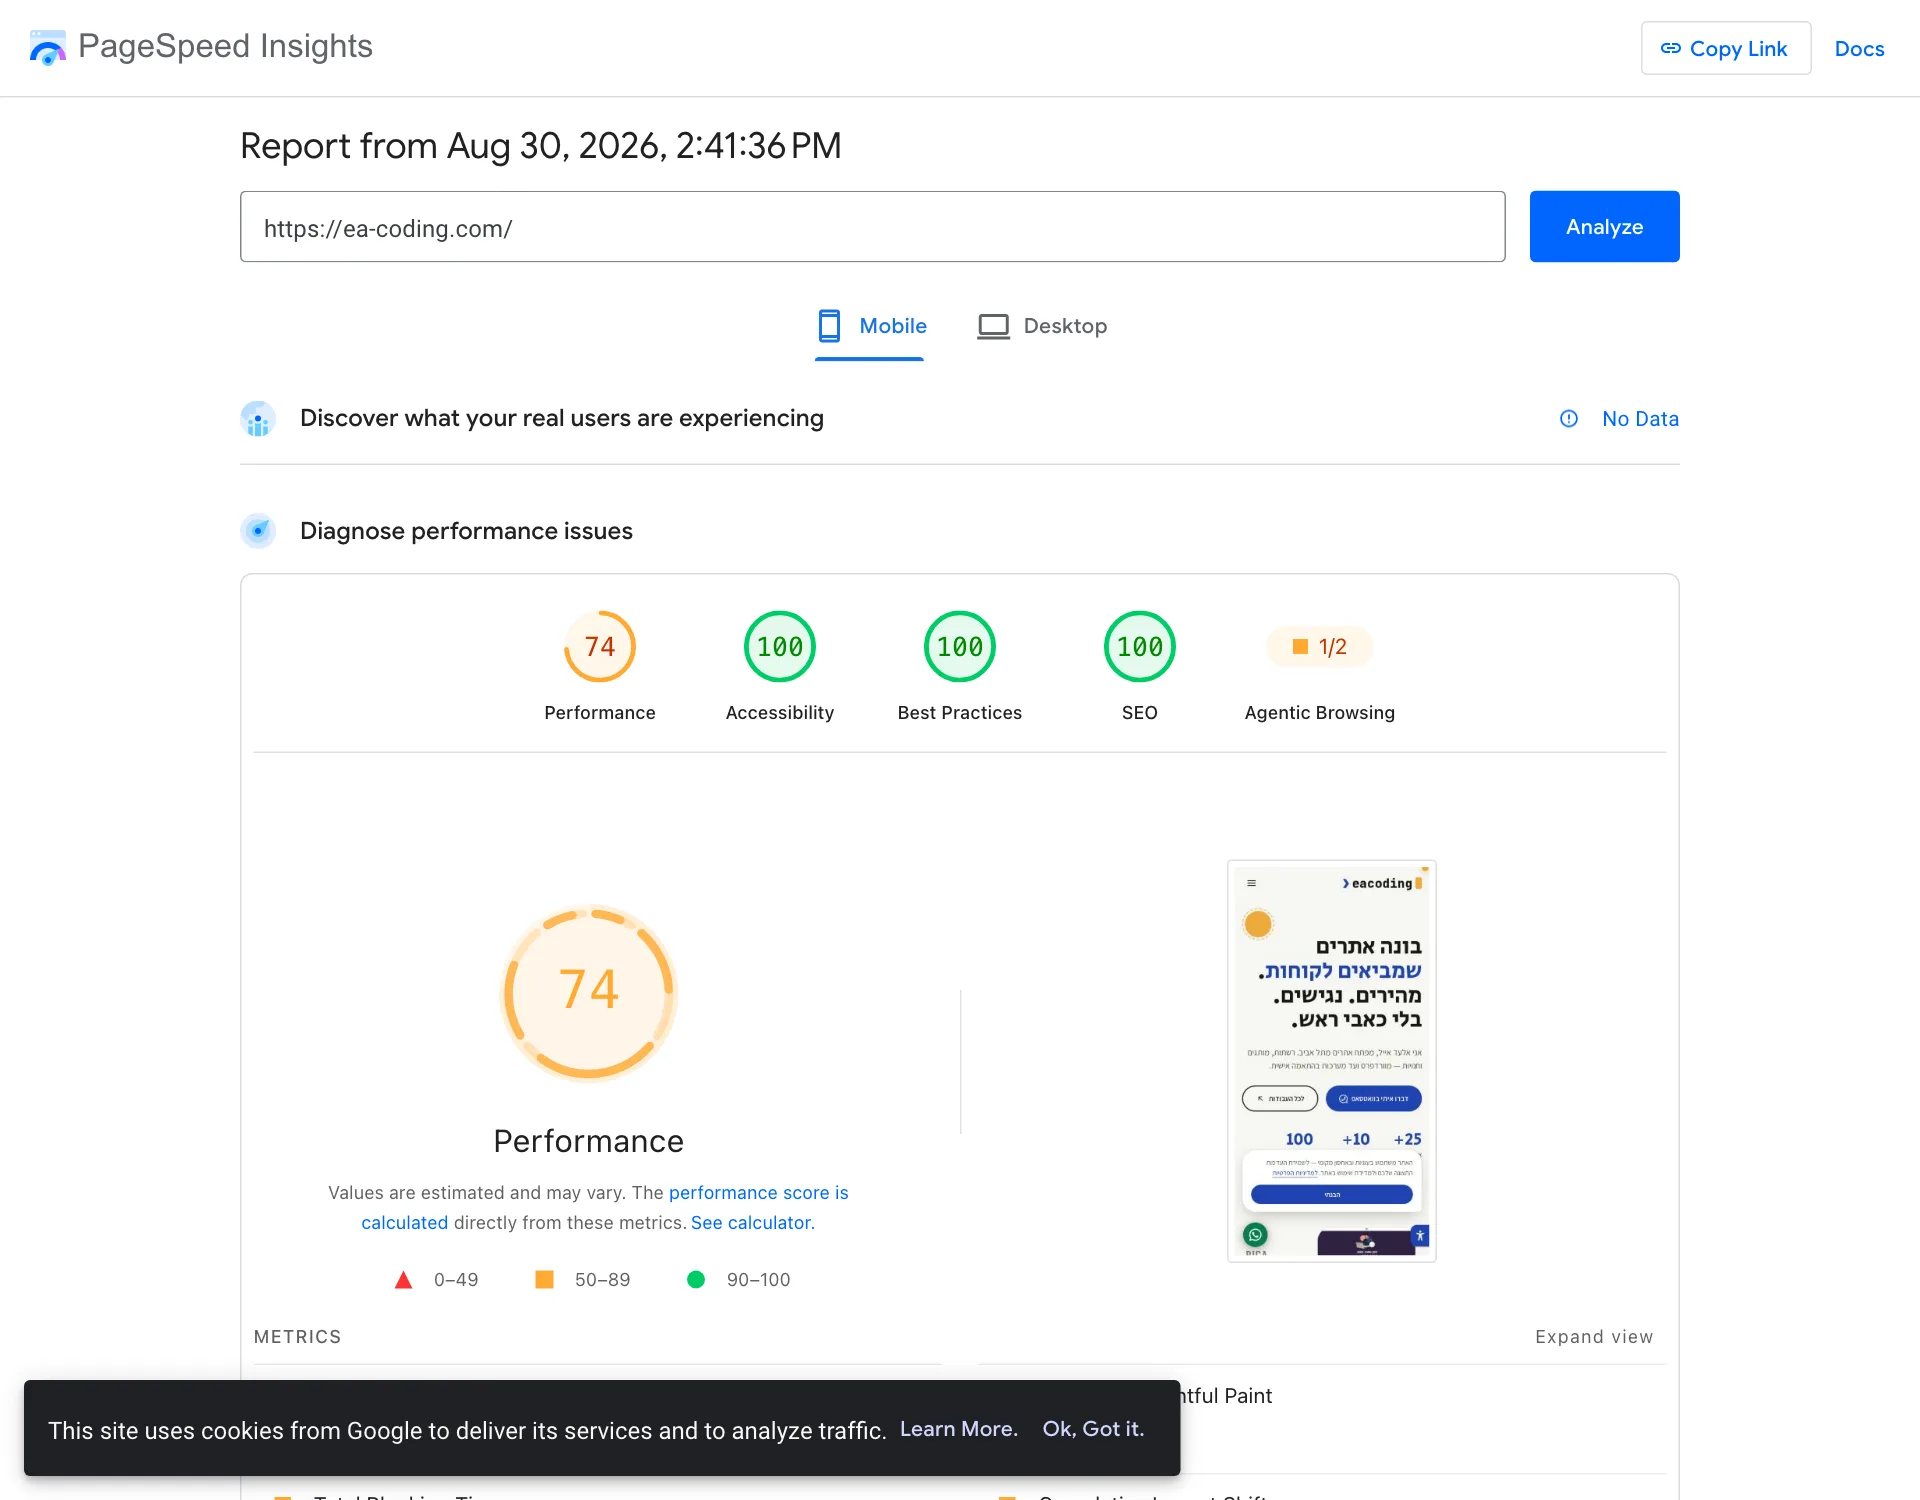
Google publishes official thresholds for each metric — green, orange, and red — and the free PageSpeed Insights tool will show you exactly where you stand, on both lab data and real-user data. But the simplest test requires no tools at all: open your site on your phone, on mobile data, in an incognito window. Count to yourself. If you reached three before you could read the headline — there's work to do.
A 100 score isn't magic and isn't luck. It's the result of removing everything from the page that doesn't serve the visitor — and loading what's left in the right order.
"I tested yesterday and got 92, today it's 68" — why the score jumps
This is probably the question I answer most, and fairly so: it's hard to take a number seriously when it moves on every refresh. The reason is that there are two completely different kinds of data, and both appear on the same screen.
Lab data. The test that ran the moment you clicked. Google simulates a mid-range device on a throttled mobile network and measures once. That figure is noisy by nature: a briefly busy server, a third-party script that responded slowly, or simply a queue on Google's side — and you're ten points down. The big coloured score is this one.
Field data. What actually happened to your real visitors over the last 30 days, drawn from Chrome usage data. This figure is stable, it doesn't move between tests, and it's the one Google acts on. It appears at the top of the report, and only if the site has enough traffic.
What that means in practice:
- Don't draw conclusions from a single test. Run three and take the middle one.
- Always test under the same conditions: mobile against mobile, same page, incognito (browser extensions distort the result).
- If you have field data, that's your answer. Lab data is a diagnostic tool that shows you why.
- After a fix, field data updates gradually over weeks, not immediately. Don't panic when the number hasn't moved the next day.
And when the gap between the two is large — green in the lab, red in the field — it almost always means your real visitors are on weaker devices or slower networks than the test simulates.
Desktop green, mobile red — which one counts?
The report shows two tabs, and they almost always tell different stories: 95 on desktop, 60 on mobile. Both numbers are correct. Only one of them matters.
The mobile test deliberately simulates a mid-range device on a throttled cellular network — not because Google is pessimistic, but because that's a real visitor's phone on the way to work. And that's exactly where most traffic to business sites comes from: ads, WhatsApp, a search on the phone. Google also ranks by the mobile version of your site, not the desktop one.
So the desktop score is nice for the ego, and the mobile score decides the leads. If you must track a single number — it's the second one.
The One Thing You Can't Fix in Code: Server Response Time
There's one component that won't budge no matter how hard you compress images: how long the server takes to start answering at all. It's called TTFB, and in plain terms it's the time from the browser asking for the page to the first character arriving. Every other optimisation only begins after that finishes.
How to tell it's your problem: if the report shows images are fine and scripts are reasonable and the score is still low, look at response time. And if the first test in the morning is slow while the second is fast, that's almost always shared hosting that was busy.
What's usually to blame:
- Cheap shared hosting where hundreds of sites share the same resources. You pay little and wait in the queue.
- A bloated database — tables filled with old post revisions, plugin logs and job queues nobody has cleared in years.
- No caching. Without a caching layer, WordPress rebuilds every page on every request, even when the page hasn't changed in six months.
- A server far from your visitors. If the audience is in Israel and the server is in the US, every request makes a round trip.
The good news: this is usually the cheapest fix relative to its impact. Moving to decent hosting with proper caching can take a full second off without touching a line of code — and that second is felt on every page, not just the homepage. How to choose hosting like that, and what to watch out for on the way — in the hosting guide.
What's fixable without a rebuild
Good news: a large share of the problems can be handled on the existing site, without touching the design:
- Compressing and converting images to modern formats, with correct dimensions and lazy loading
- Pruning plugins — removing what's unused and consolidating duplicates (three caching plugins is not "extra speed," it's an accident waiting to happen)
- Self-hosting fonts and loading only the necessary weights
- Deferring third-party widgets until after the initial render
- Caching and a CDN configured properly at the server level
- Replacing the slider with a single static hero image
Work like this delivers a noticeable jump for most sites — it's exactly the kind of thing I do in my website fixes and improvements service.
One thing to check before investing in speed
Speed multiplies an existing result — it doesn't create one. If the site isn't appearing in Google at all, the problem is probably technical and entirely different, and I covered it separately: 6 technical reasons a site doesn't show up in Google. Worth making sure the door is open before you renovate the living room.
And when does a rebuild pay off?
There's a point where optimization becomes a race against the architecture. If the site sits on a heavy builder with dozens of plugins, every improvement is a fight with the structure's limits: you can climb from a score of 40 to 70, but the last 30 points are locked inside foundations you can't swap without dismantling everything. The signs you've reached that point: every new plugin breaks something, updates scare you, and you've already paid two "speed experts" who barely moved the needle.
At that stage, a new site built lean and correct from the ground up — no layers of generic code, with performance as a baseline requirement rather than an afterthought — pays for itself within a year or two, in both money and leads. That's exactly what I build in my website development service: sites that score 100 because they were built for it, not because someone fought them into submission.
Want to know where your site stands and which route makes more sense in your case — optimization or a rebuild? Get in touch and I'll come back with an honest answer, even if it's "your site is fine, spend the money on marketing instead."
More from the blog
- Technology
Website Hosting: How to Choose, What to Watch For, and When It's the Real Problem
How to choose website hosting: a one-minute test that exposes a slow server, seven checks before signing, and when a static site is the better answer.
6 min read - Accessibility
Website Accessibility in Israel: What the Law Actually Requires (IS 5568)
A plain-language guide to Israel's website accessibility law: who must comply, what IS 5568 and WCAG AA require, and why overlay widgets fall short.
9 min read - Process
How to Choose a Web Developer: 9 Questions to Ask Before You Sign
Nine questions to ask before commissioning a site: who owns the domain and code, what happens after launch, accessibility and speed, and what if they vanish.
7 min read
Tell me what you're building.
A short message is enough. I'll get back within a business day — with a real answer, not a sales script.